Next: Coordinates in Wave Mechanics Up: WP Previous: Displaying Complex Functions
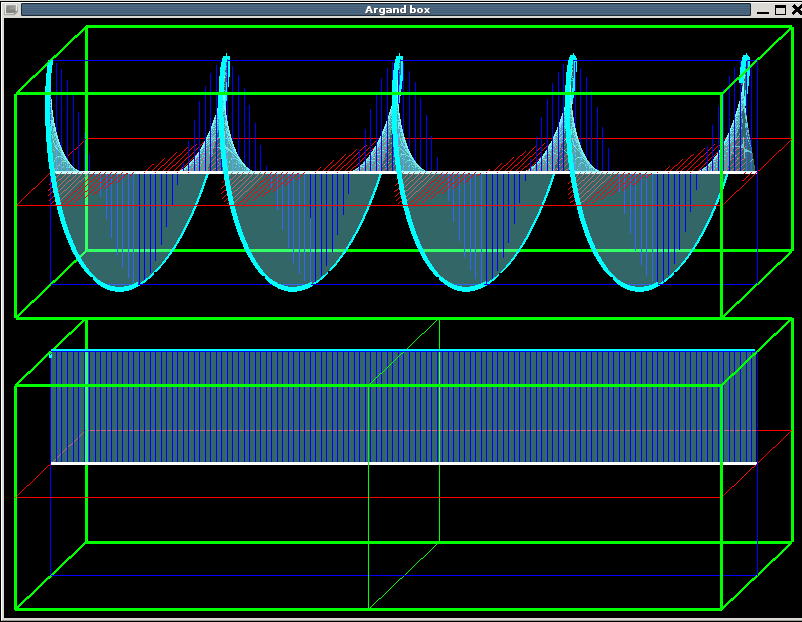 |
The false-perspective boxes are outlined in green. The end planes of the boxes represent the complex Argand plane; the vertical dimension represents the real axis, while the ``horizontal'' dimension, coming out of the screen in false perspective, represents the imaginary axis. In the upper box, the light blue line is the function itself. It begins on the left side with a real part of 1 and zero imaginary part, and rotates around the origin (the white line down the center of the box) at constant magnitude. The real and imaginary components are shown by blue and red bars in their respective planes. The lower box shows the magnitude of the function, which is constant and real. |